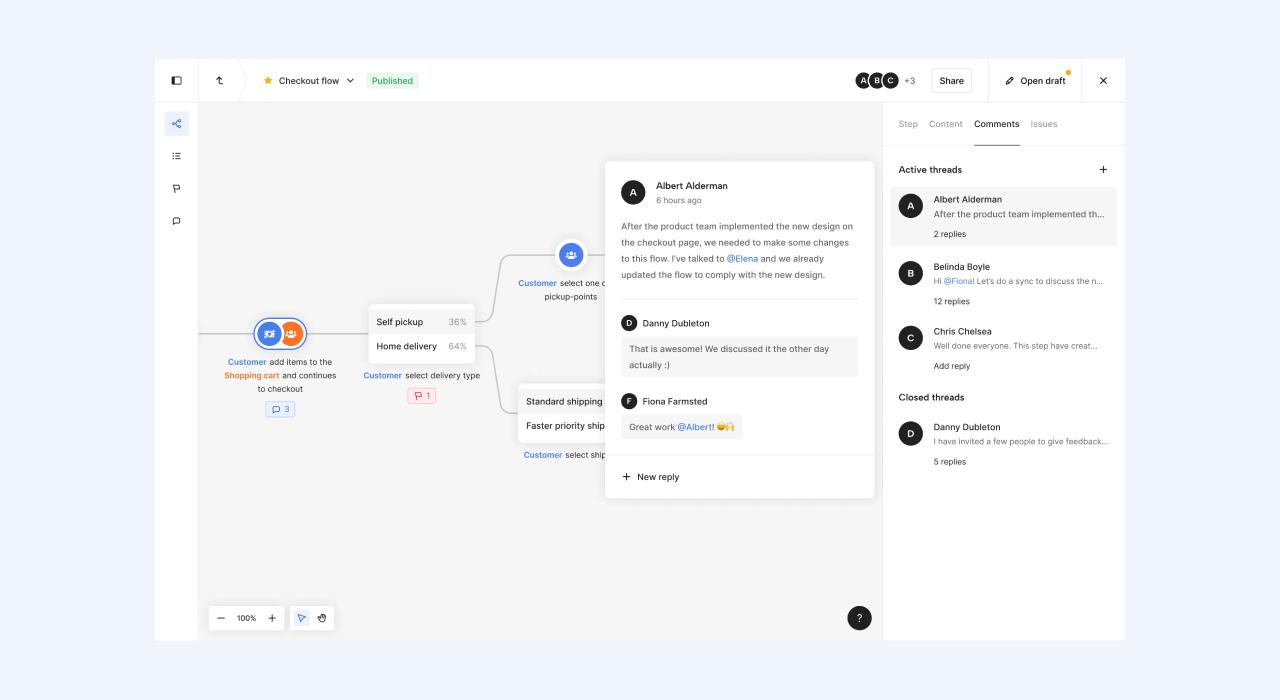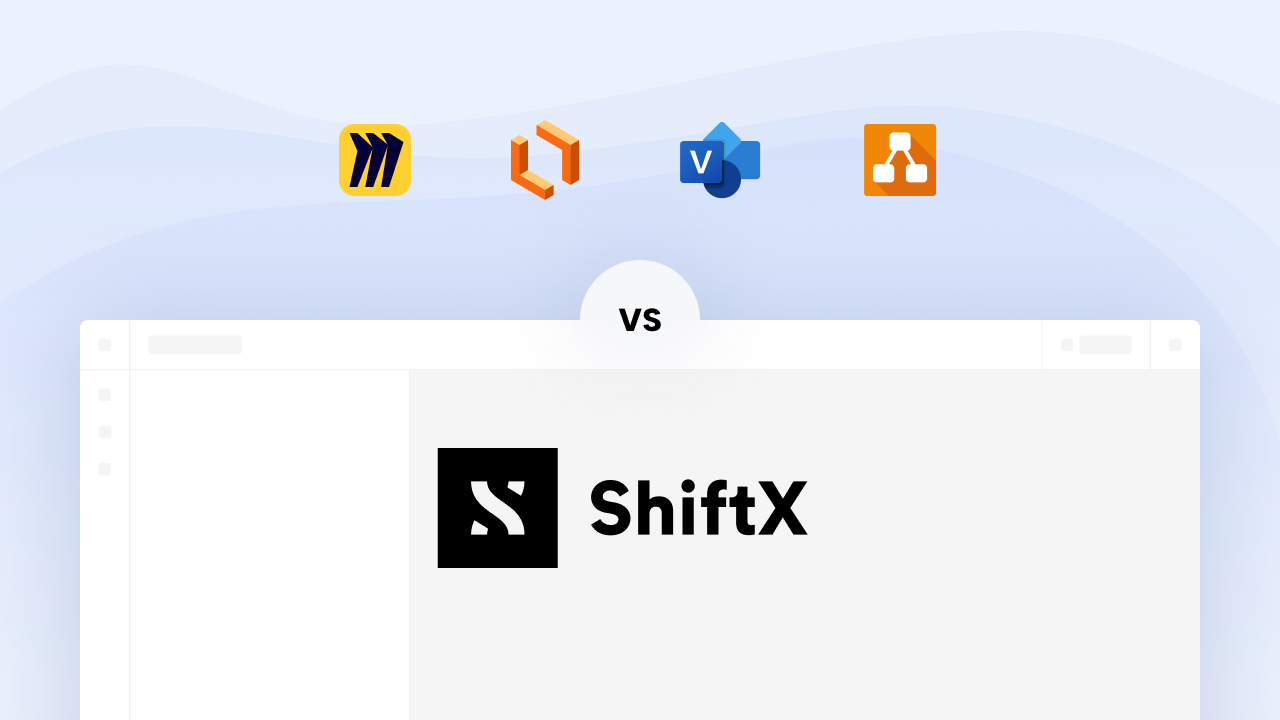
Process mapping tool – which one do you choose?
Which tool you choose is often based on company culture and heritage or personal preference. Some companies always used Microsoft Visio, and others are just more comfortable using tools not made for process mapping, like PowerPoint.
But there are many benefits by using a more intelligent tool than a "flat" whiteboard, flowchart, or slide tool to map, keep track of, and continuously work with your processes
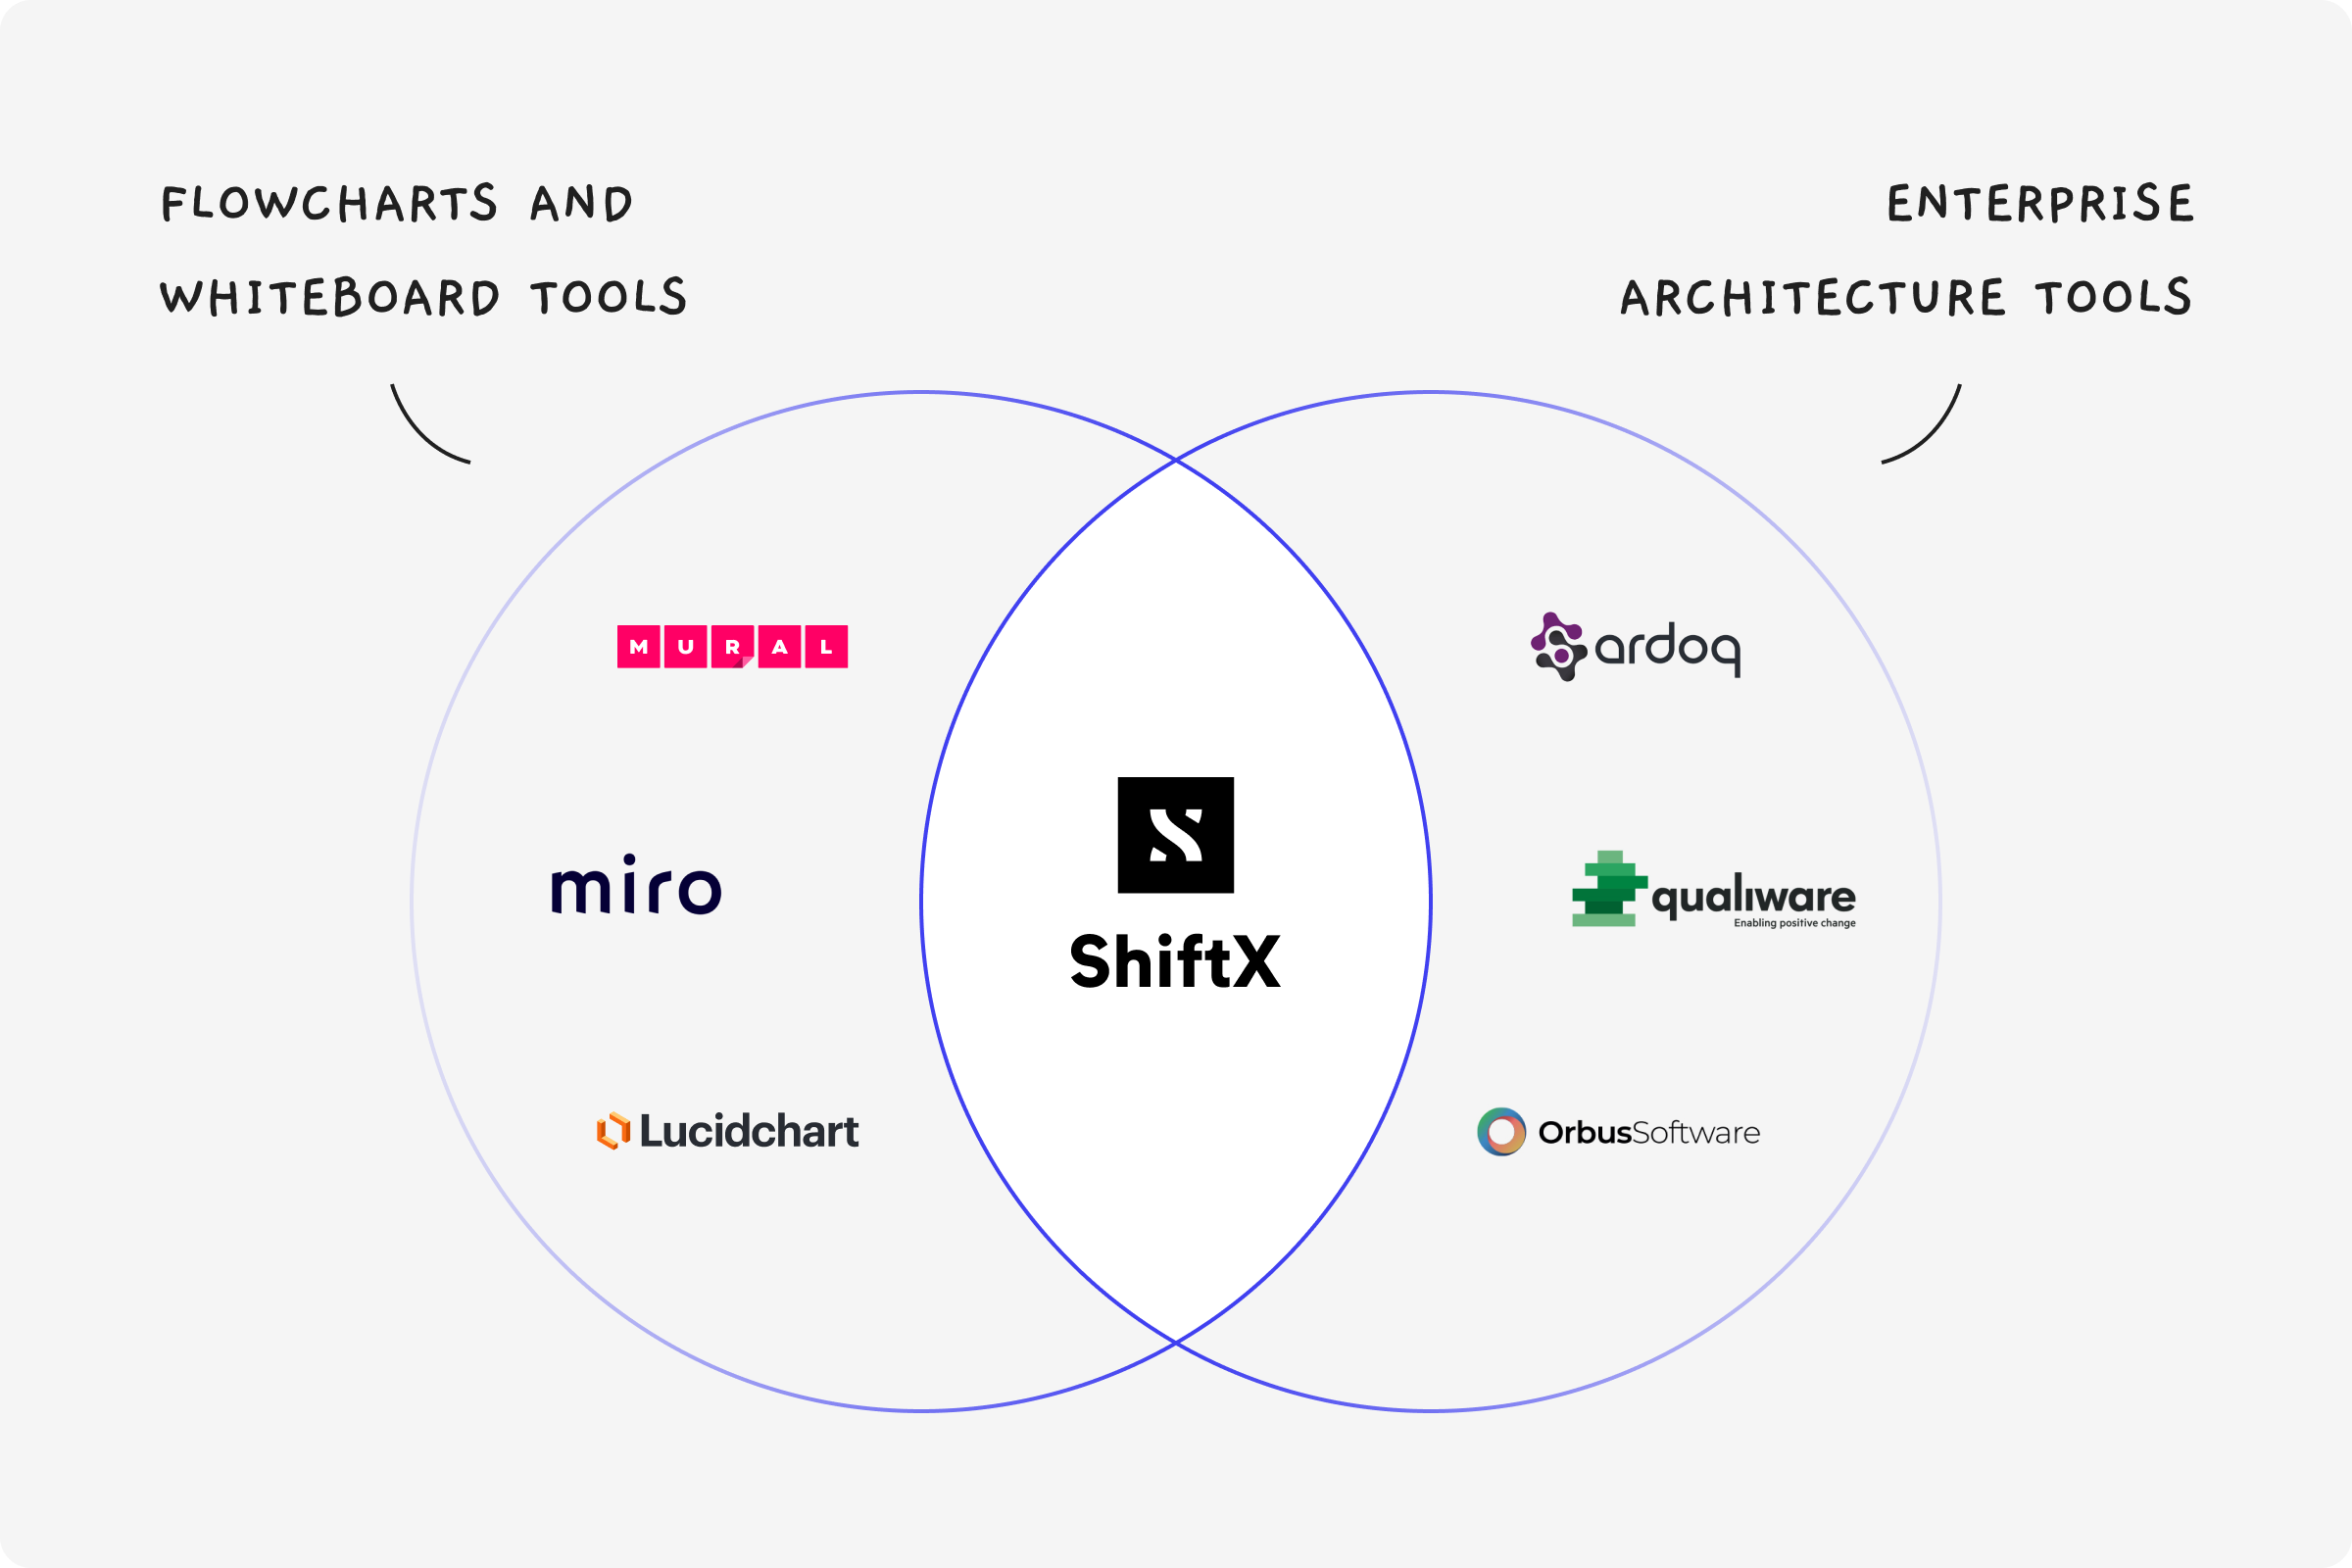
Flowchart and whiteboard vs Enterprise Architecture (EA) tools
Many flowchart and whiteboard tools are ways to digitally co-create and collaborate on ideas. Whiteboard and flowchart tools often offer flexibility to move shapes, arrows, and symbols around to create (almost) whatever you like. And it's very often very intuitive and user-friendly – anyone can join in without having to do training or courses.
But what you end up with when you’re done in a whiteboard or flowchart tool is a static drawing of your processes, a “dead, flat” picture of what you’ve drawn.
On the other hand, enterprise Architecture (EA) tools are often more complex and less flexible. EA is often seen as so complex, it’s an own profession, with its certifications and courses.
With EA, you’ll get a nuanced picture, often with data, dashboards, and an overview of who and what are involved where. But you often end up with process mapping being left for an expert, the architects, with the rest of your organization (that don’t have the tool skills demanded) being excluded from the mapping. Their perspectives are lost.
- Flowchart and whiteboard tools offer flexibility and user-friendly user interfaces but lack the smartness you get with connected data, dashboards, and “trackability” – they give you static drawings of your situation.
- EA tools offer smartness, nuance, and complexity but exclude non-architects from the process mapping – what could (and should) be a collective mapping process across departments ends up being done by a couple of experts alone.
Do you have to choose between either of them?
ShiftX – In between whiteboards and EA tools
Now you might be wondering if there are tools that have the best of both worlds, the usability and “low bar to start” of flowchart and whiteboard tools, and the smartness of the EA tools, without excluding the non-architects?
Democratizing process mapping with a user-friendly interface
An essential part of mapping your processes is securing an accurate picture of how things interact and are connected in your organization. In our eyes, that can only be done by involving the people of your different departments in the actual mapping process, either in collaborative, digital tools, or live workshops.
Leaving process mapping only to tool experts or enterprise architects will (in a lot of cases) not give the complete or right picture of how things are done in your organization.
As Director of Digitalization of Economy at OBOS, Hilde Rannem Rostad, says in the video below, process work is about including and involving the people working with them.
Keep track of all your people, departments, and systems
The main difference between the “flat” drawing tools like Whimsical, Miro and the more complex, “smarter” tools, is that the complex tools often “connect data.”
Mapping something in a whiteboard tool means you have a static drawing. If you map five different processes like that, and you’re interested in how many of them your sales department appears in and how often they appear, you have to count manually.
In ShiftX, everything is data. That means you can keep track of where and how many times each tagged system, department, or person appears across your flows.
We call systems, departments, and persons actors in ShiftX, and all your actors are available in their actor dashboard, where you can keep track of how often and in what processes your actors appear. Check out our short tutorial for more information about how actors are mapped in ShiftX:
See how your processes develop with version control
If you map your processes in a whiteboard or flowchart tool, and something changes, you have to do a lot of mapping all over again. Or even worse, if you’ve made many changes to your process map in a flowchart or whiteboard tool but suddenly want to go back to an old version, it’s lost.
In ShiftX, you can easily navigate between all your different published versions. So in 2026, if you want to see how your company did onboarding of new employees back in 2021, simply navigate back to an old version of that flow.
Check out our short tutorial on how you can publish new versions of your business processes, and view old ones:
Summary
When choosing what tool to use when you’re starting your process mapping, there are some things to consider.
Do you need to optimize, streamline, and improve your business processes continuously after you’re done with your first mapping?
If so, you’ll need a tool where change is easy and where your mapping doesn’t end up as a static drawing but a “living,” changeable process map.
Do you need to get an overview of the systems and departments involved in all of your mapped processes?
If so, you’ll need a process overview that is not just a “flat” flowchart or whiteboard drawing of your process(es), but a tool that connects data to what you’re mapping and serves you this data in dashboards and overviews to let you keep control.
Get started for free
As we want to be the business process tool for everyone, we offer a free forever license for single users in ShiftX, where you can map as much as you'd like in five different flows.
If you want to map more than five flows or map together with your colleagues, you can scale to our Team license. Click “Get started” below to register, or check out our pricing page.
